



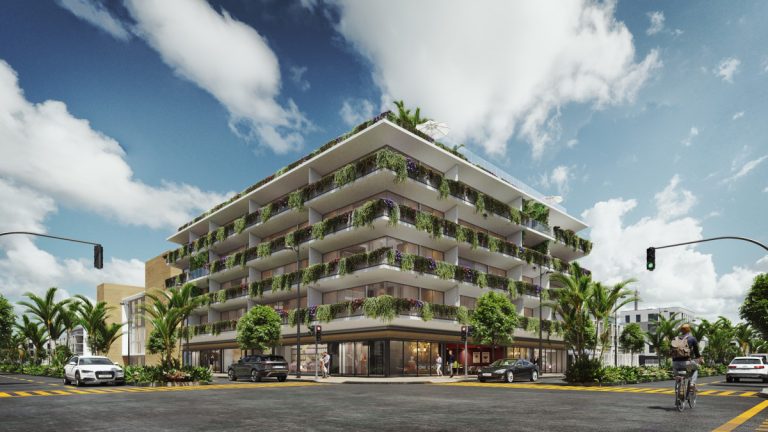
Sensai Condos Playa del Carmen
Side by side: key facts, amenities, payment plans, investment returns and each developer’s track record. Choose a unit type under each property.
Photo: Sensai Condos Playa del Carmen|
Choose a unit type under each property: the tables below follow your choice. |
|
Add a property Compare up to 3 properties: add another one from the listings. | Add a property Compare up to 3 properties: add another one from the listings. |
|---|
Payment plan
Minimum 30% down payment. Developers are always open to a custom payment plan that fits your needs.
| Payment plan |
30% down payment, 70% on delivery 50% down payment, 50% on delivery 3% off the list price 80% down payment, 20% on delivery 5% off the list price |
||
|---|---|---|---|
| Cheapest unit on this plan |
Unit D115 · level 1
Unit D115 · level 1
Unit D115 · level 1
Unit D210 · level 2
Unit D210 · level 2
Unit D210 · level 2
Unit D101 · level 1
Unit D101 · level 1
Unit D101 · level 1
|
||
| Size (total area) |
44.9 m²
44.9 m²
44.9 m²
66.4 m²
66.4 m²
66.4 m²
84.7 m²
84.7 m²
84.7 m²
|
||
| Price on this plan |
$148,000 USD
$144,000 USD
$141,000 USD
$227,000 USD
$220,000 USD
$216,000 USD
$290,000 USD
$281,000 USD
$276,000 USD
|
||
| What you pay and when |
$44,400 USD down payment$103,600 USD on delivery
$72,000 USD down payment$72,000 USD on delivery
$112,800 USD down payment$28,200 USD on delivery
$68,100 USD down payment$158,900 USD on delivery
$110,000 USD down payment$110,000 USD on delivery
$172,800 USD down payment$43,200 USD on delivery
$87,000 USD down payment$203,000 USD on delivery
$140,500 USD down payment$140,500 USD on delivery
$220,800 USD down payment$55,200 USD on delivery
|
Prices may change without prior notice. Prices and availability are confirmed with the developer when you are ready to make an offer.
Key facts
| Delivery | Immediate delivery | ||
|---|---|---|---|
| Location | Playa del CarmenTourist zone | ||
| Beach Linear Distance |
980 m
|
||
| Prices start at |
$141,000 USD
|
||
| Price per m² (median, available units) |
$3,427 USD/m²
6% below the nearby projects
|
||
| Price change (developer's lowest list price) | No change recorded yetDevelopers typically raise prices about twice a year (2.5–4%) | ||
| Property types | Condos | ||
| Residences | 72 | ||
| Available | 25 |
||
| Sold or reserved |
65%
47 of 72 units sold or reserved |
||
| Selling pace | ~1.0 units/month Launched: Jan 2023 |
||
| Furnished & Turn-Key | No |
Amenities 19 amenities
| Rooftop terrace | |||
|---|---|---|---|
| Rooftop pool | |||
| Two swimming pools | |||
| Jacuzzi | |||
| Sunbeds | |||
| Lounge area | |||
| Sundeck | |||
| Hydromassage area | |||
| Gym | |||
| Coworking space | |||
| Green terraces | |||
| Lobby | |||
| Elevator | |||
| Security | |||
| Underground parking | |||
| Commercial area | |||
| Pet-friendly | |||
| 24/7 security | |||
| Security cameras |
Selected unit type
Available units of the type chosen above
| Unit type |
Studio
1 BR
2 BR
|
||
|---|---|---|---|
| Units of this type |
11 available of 16
8 available of 10
6 available of 7
|
||
| Price range |
$141,000 USD – $177,000 USD
$216,000 USD – $251,000 USD
$276,000 USD – $328,000 USD
|
Investment results
Our investment calculator’s answers for the unit above, with its default assumptions
| 5-year return on investment |
62.6%Total return: $99,327 USD
67.6%Total return: $104,044 USD
71.1%Total return: $107,188 USD
56.8%Total return: $136,215 USD
61.6%Total return: $143,368 USD
65.0%Total return: $148,137 USD
73.7%Total return: $225,508 USD
79.0%Total return: $234,648 USD
82.8%Total return: $240,741 USD
|
||
|---|---|---|---|
| Where the 5-year return comes from |
|
||
| Cash flow, year by year |
|
||
| How you pay |
Pre-sale (developer's payment plan)
Pre-sale (developer's payment plan)
Pre-sale (developer's payment plan)
Pre-sale (developer's payment plan)
Pre-sale (developer's payment plan)
Pre-sale (developer's payment plan)
Pre-sale (developer's payment plan)
Pre-sale (developer's payment plan)
Pre-sale (developer's payment plan)
|
||
| Cash invested |
$158,724 USD
$154,008 USD
$150,863 USD
$239,940 USD
$232,787 USD
$228,018 USD
$306,155 USD
$297,016 USD
$290,922 USD
|
||
| Rental assumption |
$65 USD per night · 70% occupancy
$65 USD per night · 70% occupancy
$65 USD per night · 70% occupancy
$75 USD per night · 70% occupancy
$75 USD per night · 70% occupancy
$75 USD per night · 70% occupancy
$150 USD per night · 65% occupancy
$150 USD per night · 65% occupancy
$150 USD per night · 65% occupancy
|
||
| Gross rental income |
$1,384 USD / month
$1,384 USD / month
$1,384 USD / month
$1,597 USD / month
$1,597 USD / month
$1,597 USD / month
$2,966 USD / month
$2,966 USD / month
$2,966 USD / month
|
||
| Operating expenses |
$585 USD / month
$585 USD / month
$585 USD / month
$670 USD / month
$670 USD / month
$670 USD / month
$981 USD / month
$981 USD / month
$981 USD / month
|
||
| Net operating income |
$799 USD / month
$799 USD / month
$799 USD / month
$926 USD / month
$926 USD / month
$926 USD / month
$1,985 USD / month
$1,985 USD / month
$1,985 USD / month
|
||
| Cap rate |
6.5%
6.7%
6.8%
4.9%
5.0%
5.2%
8.2%
8.5%
8.6%
|
||
| Cash-on-cash return |
6.0%
6.2%
6.4%
4.6%
4.8%
4.9%
7.8%
8.0%
8.2%
|
||
| Rental income starts |
now
now
now
now
now
now
now
now
now
|
||
| Value in 5 years |
$207,135 USD
$207,135 USD
$207,135 USD
$317,124 USD
$317,124 USD
$317,124 USD
$405,190 USD
$405,190 USD
$405,190 USD
|
||
| Break-even (rental income only) |
16.6 years
16.1 years
15.7 years
21.6 years
20.9 years
20.5 years
12.9 years
12.5 years
12.2 years
|
||
| Full financial study |
Projections, not predictions: results depend on the assumptions above and are not financial advice. Rental income, occupancy and exchange rates vary; income taxes, repairs and selling costs are not included. Prices and availability may change without prior notice; please confirm them with us. Change the assumptions in the investment calculator
The developer's track record
| Experience and facts |
|
||
|---|---|---|---|
| Other projects by this developer |
|