


Urban Towers Condos Playa del Carmen vs Wave Residences Condos Playa del Carmen
Side by side: key facts, amenities, payment plans, investment returns and each developer’s track record. Choose a unit type under each property.
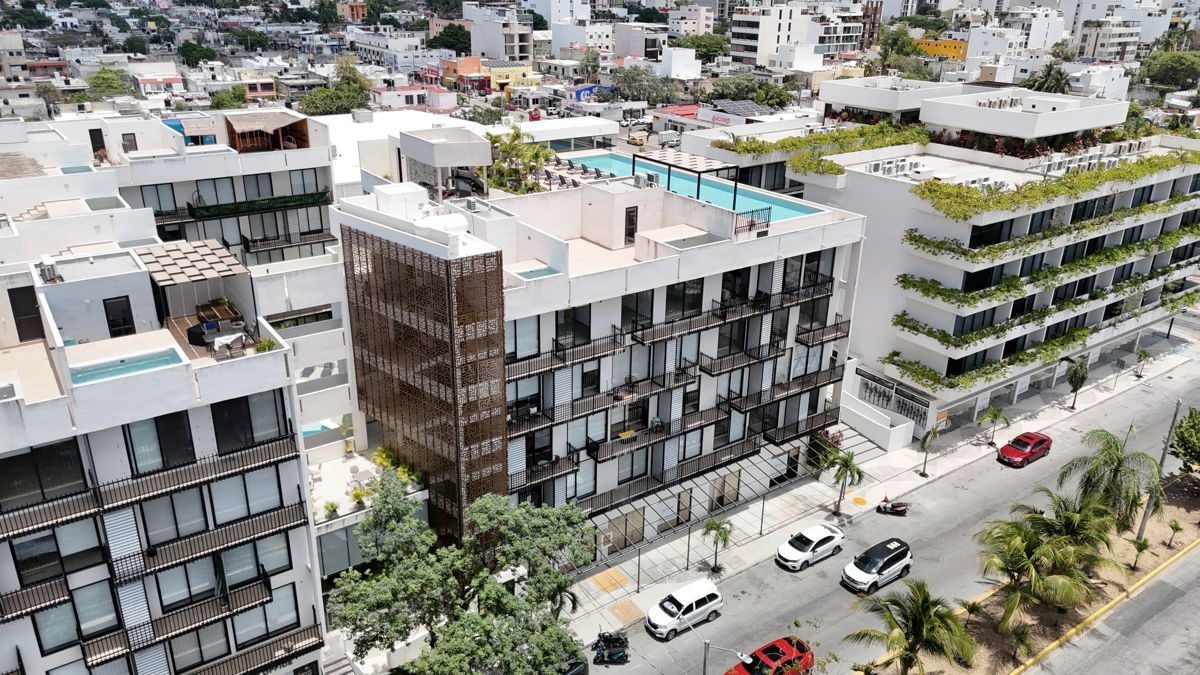
Photo: Urban Towers Condos Playa del Carmen|
Choose a unit type under each property: the tables below follow your choice. |
|
|
Add a property Compare up to 3 properties: add another one from the listings. |
|---|
Payment plan
Minimum 30% down payment. Developers are always open to a custom payment plan that fits your needs.
| Payment plan |
30% down payment, 70% on delivery 50% down payment, 50% on delivery 3% off the list price 80% down payment, 20% on delivery 5% off the list price |
30% down payment, 70% on delivery 50% down payment, 50% on delivery |
|
|---|---|---|---|
| Cheapest unit on this plan |
Unit A008 · level PB
Unit A008 · level PB
Unit A008 · level PB
Unit B103 · level 1
Unit B103 · level 1
Unit B103 · level 1
Unit A409 · level 4
Unit A409 · level 4
Unit A409 · level 4
|
Unit 204 · level PB
Unit 204 · level PB
Unit 223 · level 2
Unit 223 · level 2
Unit 131 · level 3
Unit 131 · level 3
|
|
| Size (total area) |
97.4 m²
97.4 m²
97.4 m²
95.9 m²
95.9 m²
95.9 m²
65.3 m²
65.3 m²
65.3 m²
|
73.43 m²
73.43 m²
88.07 m²
88.07 m²
195.15 m²
195.15 m²
|
|
| Price on this plan |
$297,000 USD
$288,000 USD
$282,000 USD
$285,000 USD
$277,000 USD
$271,000 USD
$259,000 USD
$251,000 USD
$246,000 USD
|
$170,000 USD
$170,000 USD
$192,000 USD
$192,000 USD
$290,000 USD
$290,000 USD
|
|
| What you pay and when |
$89,100 USD down payment$207,900 USD on delivery
$144,000 USD down payment$144,000 USD on delivery
$225,600 USD down payment$56,400 USD on delivery
$85,500 USD down payment$199,500 USD on delivery
$138,500 USD down payment$138,500 USD on delivery
$216,800 USD down payment$54,200 USD on delivery
$77,700 USD down payment$181,300 USD on delivery
$125,500 USD down payment$125,500 USD on delivery
$196,800 USD down payment$49,200 USD on delivery
|
$51,000 USD down payment$119,000 USD on delivery
$85,000 USD down payment$85,000 USD on delivery
$57,600 USD down payment$134,400 USD on delivery
$96,000 USD down payment$96,000 USD on delivery
$87,000 USD down payment$203,000 USD on delivery
$145,000 USD down payment$145,000 USD on delivery
|
Prices may change without prior notice. Prices and availability are confirmed with the developer when you are ready to make an offer.
Key facts
| Delivery | Immediate delivery | Immediate delivery | |
|---|---|---|---|
| Location | Playa del Carmen | Playa del CarmenResidential zone | |
| Beach Linear Distance |
1,060 m
|
2,040 m
|
|
| Prices start at |
$246,000 USD
|
$170,000 USD
|
|
| Price per m² (median, available units) |
$3,483 USD/m²
3% below the nearby projects
|
$2,256 USD/m²
In line with the nearby projects
|
|
| Price change (developer's lowest list price) | No change recorded yetDevelopers typically raise prices about twice a year (2.5–4%) | -4.9%since Oct 2023 | |
| Property types | Condos | Condos | |
| Residences | 91 | 42 | |
| Available | 8 |
14 |
|
| Sold or reserved |
91%
|
67%
28 of 42 units sold or reserved |
|
| Selling pace | To be confirmed | ~0.8 units/month Launched: Oct 2023 |
|
| Furnished & Turn-Key | No | No | |
| Direct financing | — | Yes |
Amenities 18 amenities18 amenities
| Sun loungers | |||
|---|---|---|---|
| Gym | |||
| 24/7 security | |||
| Security cameras | |||
| Rooftop pool | — | ||
| Two swimming pools | — | ||
| Private panoramic roof garden | — | ||
| Bar and grill | — | ||
| Zen garden | — | ||
| Sundeck | — | ||
| Kids club | — | ||
| Private cinema | — | ||
| Lobby | — | ||
| Two elevators | — | ||
| Security | — | ||
| Underground parking | — | ||
| Pet friendly (excluding common areas) | — | ||
| Lock-Off | — | ||
| Swimming pool | — | ||
| Central garden | — | ||
| Coworking space | — | ||
| BBQ area | — | ||
| Yoga room | — | ||
| Game room | — | ||
| Kids' area | — | ||
| Parking | — | ||
| Private jacuzzi units | — | ||
| Private rooftop units | — | ||
| Air conditioning | — | ||
| Equipped apartments | — | ||
| Pet-friendly | — | ||
| Lobby reception | — |
Selected unit type
Available units of the type chosen above
| Unit type |
2 BR
3 BR
PH
|
1 BR
2 BR
3 BR
|
|
|---|---|---|---|
| Units of this type |
1 available of 1
3 available of 3
4 available of 4
|
4 available of 4
9 available of 9
1 available of 1
|
|
| Price range |
$282,000 USD – $297,000 USD
$271,000 USD – $285,000 USD
$246,000 USD – $381,000 USD
|
$170,000 USD – $223,000 USD
$192,000 USD – $270,000 USD
$290,000 USD
|
Investment results
Our investment calculator’s answers for the unit above, with its default assumptions
| 5-year return on investment |
72.2%Total return: $226,216 USD
77.5%Total return: $235,567 USD
81.2%Total return: $241,801 USD
88.8%Total return: $267,398 USD
94.6%Total return: $276,388 USD
98.7%Total return: $282,381 USD
87.6%Total return: $239,676 USD
93.4%Total return: $247,834 USD
97.5%Total return: $253,274 USD
|
62.7%Total return: $113,816 USD
62.7%Total return: $113,816 USD
92.4%Total return: $189,000 USD
92.4%Total return: $189,000 USD
83.8%Total return: $256,278 USD
83.8%Total return: $256,278 USD
|
|
|---|---|---|---|
| Where the 5-year return comes from |
|
|
|
| Cash flow, year by year |
|
|
|
| How you pay |
Pre-sale (developer's payment plan)
Pre-sale (developer's payment plan)
Pre-sale (developer's payment plan)
Pre-sale (developer's payment plan)
Pre-sale (developer's payment plan)
Pre-sale (developer's payment plan)
Pre-sale (developer's payment plan)
Pre-sale (developer's payment plan)
Pre-sale (developer's payment plan)
|
Pre-sale (developer's payment plan)
Pre-sale (developer's payment plan)
Pre-sale (developer's payment plan)
Pre-sale (developer's payment plan)
Pre-sale (developer's payment plan)
Pre-sale (developer's payment plan)
|
|
| Cash invested |
$313,204 USD
$303,853 USD
$297,619 USD
$301,160 USD
$292,170 USD
$286,177 USD
$273,464 USD
$265,305 USD
$259,866 USD
|
$181,630 USD
$181,630 USD
$204,545 USD
$204,545 USD
$305,791 USD
$305,791 USD
|
|
| Rental assumption |
$150 USD per night · 65% occupancy
$150 USD per night · 65% occupancy
$150 USD per night · 65% occupancy
$230 USD per night · 55% occupancy
$230 USD per night · 55% occupancy
$230 USD per night · 55% occupancy
$160 USD per night · 70% occupancyTop performer case
$160 USD per night · 70% occupancyTop performer case
$160 USD per night · 70% occupancyTop performer case
|
$75 USD per night · 70% occupancy
$75 USD per night · 70% occupancy
$150 USD per night · 65% occupancy
$150 USD per night · 65% occupancy
$230 USD per night · 55% occupancy
$230 USD per night · 55% occupancy
|
|
| Gross rental income |
$2,966 USD / month
$2,966 USD / month
$2,966 USD / month
$3,848 USD / month
$3,848 USD / month
$3,848 USD / month
$3,407 USD / month
$3,407 USD / month
$3,407 USD / month
|
$1,597 USD / month
$1,597 USD / month
$2,966 USD / month
$2,966 USD / month
$3,848 USD / month
$3,848 USD / month
|
|
| Operating expenses |
$1,006 USD / month
$1,006 USD / month
$1,006 USD / month
$1,180 USD / month
$1,180 USD / month
$1,180 USD / month
$1,030 USD / month
$1,030 USD / month
$1,030 USD / month
|
$685 USD / month
$685 USD / month
$988 USD / month
$988 USD / month
$1,378 USD / month
$1,378 USD / month
|
|
| Net operating income |
$1,959 USD / month
$1,959 USD / month
$1,959 USD / month
$2,668 USD / month
$2,668 USD / month
$2,668 USD / month
$2,376 USD / month
$2,376 USD / month
$2,376 USD / month
|
$912 USD / month
$912 USD / month
$1,978 USD / month
$1,978 USD / month
$2,470 USD / month
$2,470 USD / month
|
|
| Cap rate |
7.9%
8.2%
8.3%
11.2%
11.6%
11.8%
11.0%
11.4%
11.6%
|
6.4%
6.4%
12.4%
12.4%
10.2%
10.2%
|
|
| Cash-on-cash return |
7.5%
7.7%
7.9%
10.6%
11.0%
11.2%
10.4%
10.7%
11.0%
|
6.0%
6.0%
11.6%
11.6%
9.7%
9.7%
|
|
| Rental income starts |
now
now
now
now
now
now
now
now
now
|
now
now
now
now
now
now
|
|
| Value in 5 years |
$414,565 USD
$414,565 USD
$414,565 USD
$398,546 USD
$398,546 USD
$398,546 USD
$361,711 USD
$361,711 USD
$361,711 USD
|
$237,312 USD
$237,312 USD
$267,501 USD
$267,501 USD
$404,705 USD
$404,705 USD
|
|
| Break-even (rental income only) |
13.3 years
12.9 years
12.7 years
9.4 years
9.1 years
8.9 years
9.6 years
9.3 years
9.1 years
|
16.6 years
16.6 years
8.6 years
8.6 years
10.3 years
10.3 years
|
|
| Full financial study |
Projections, not predictions: results depend on the assumptions above and are not financial advice. Rental income, occupancy and exchange rates vary; income taxes, repairs and selling costs are not included. Prices and availability may change without prior notice; please confirm them with us. Change the assumptions in the investment calculator
The developer's track record
| Experience and facts |
|
|
|
|---|---|---|---|
| Other projects by this developer |
|
|